Zinc * USD/lb
0.00
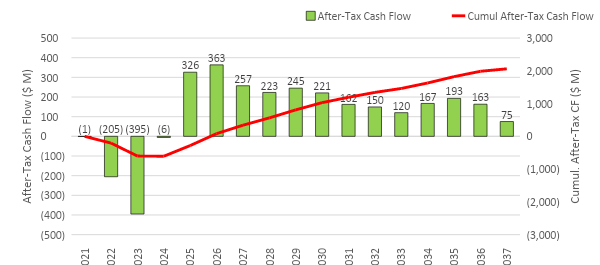
After-Tax IRR of 30%, NPV6%, $1.07 Billion, Payback 2.3 years - Base Case
Toronto, Ontario – 3 March 2021 – Generation Mining Limited (TSX: GENM; OTCQB: GENMF) (“Gen Mining” or the “Company”) is pleased to announce the results of the Feasibility Study for the Marathon Palladium and Copper Project (the “Project”) located near the Town of Marathon in Northwestern Ontario. The Feasibility Study supports an open pit mining operation with a robust rate of return over a 13-year mine life.
All dollar amounts are in Canadian dollars and stated on a 100% project ownership basis unless otherwise noted.
Feasibility Study Highlights:
1Spot Price on 22 February 2021: Pd = US$2,395/oz; Cu = US$3.99/lb; Pt = US$1,268/oz; Au = US$ 1,807/oz; Ag = US$27.45/oz; Pd, Pt, Au and Ag prices sourced LBMA; Cu price sourced on LME Copper; C$/US$ exchange rate = 1.266, sourced Bank of Canada prior week average ending 22 Feb. 2021
2Pd eq grade is calculated based on:

Jamie Levy, President and CEO of Gen Mining commented, “This study confirms that the Marathon Palladium and Copper Project is a substantial mining project that is expected to provide a very robust return on investment. We expect the palladium supply in particular to remain in deficit for the foreseeable future as Europe, China and other regions roll out tougher emissions standards. We are excited about the opportunity to create jobs and economic stimulus to Canada, Ontario and to the communities surrounding Marathon.”
“With the consensus outlook for palladium and copper strong for the next decade,” commented Executive Chairman Kerry Knoll, “this is a project whose time has come. With little new PGM mine capacity being scheduled to come on stream over the next few years, Gen Mining plans to advance the environmental approval process, detailed engineering and mine financing during the remainder of 2021. We anticipate being able to begin construction next year subject to permitting approvals and financing arrangements.”
Drew Anwyll, P.Eng, Chief Operating Officer, said, “The process plant was designed at a capacity of 9.2 Mt per year with the flowsheet realizing improved metallurgical recoveries compared to past proposed designs; in addition, the mine plan includes strategic sequencing of the open pit that targets the higher grade palladium in the first half of the mine life. With these key design elements, and a realistic initial capital, we have a Project that demonstrates exceptional financial results and a quick payback period of 2.3 years.”
Gen Mining owns an 80% interest in the Project, with the remaining interest owned by Sibanye Stillwater Limited (“Sibanye-Stillwater”). Sibanye-Stillwater has certain back-in rights that allow it to increase its interest in the Project to 51% in certain circumstances and subject to certain conditions (see News Release of July 9, 2019 for details). The Feasibility Study has not yet been approved by the Joint Venture management committee and Sibanye-Stillwater and as a next step, Sibanye-Stillwater and the management committee are planning to review the Feasibility Study.
The Feasibility Study was prepared by G Mining Services Inc. (“GMS”), along with contributions from Ausenco Engineering Canada Inc. (“Ausenco”), Haggarty Technical Services (“HTS”), Knight Piésold Ltd. (“KP”), WESC Inc. and P&E Mining Consultants Inc. (“P&E”).
Conference Call
Gen Mining will host a Webinar with management to discuss these results on Thursday, March 4 at 8:30 a.m. EST. The webinar can be accessed through the link below or by signing up for news at the Company website at www.Genmining.com.
Thursday March 4th, 830am Eastern
Link: https://my.6ix.com/C_A56uL6
Attendee Dial-in Number: +1 (312) 248-9348
Attendee Dial-in ID Number: 301668
Attendee Dial-in Passcode: 3422
Marathon PALLADIUM and COPPER Project Feasibility Study
Key results and assumptions used in the Feasibility Study are summarized in the table below.
|
Price Assumptions1 |
Units |
Base Case |
|
Palladium |
US$/oz |
$1,725 |
|
Copper |
US$/lb |
$3.20 |
|
Platinum |
US$/oz |
$1,000 |
|
Gold |
US$/oz |
$1,400 |
|
Silver |
US$/oz |
$20.00 |
|
Exchange Rate |
C$/US$ |
1.28 |
|
Diesel Fuel |
$/L |
0.77 |
|
Electricity |
$/kWhr |
0.08 |
|
Note: 1 Commodities listed in order of revenue. |
||
|
Operating Data |
Units |
Pre-Production |
Operations |
Total |
|
Mine life |
years |
2 |
12.6 |
14.6 |
|
Total Milled Tonnes |
Mt |
1.9 |
115.8 |
117.7 |
|
Total Mined Tonnes |
Mt |
25.4 |
421.8 |
447 |
|
Strip Ratio |
waste:ore |
3.33 |
2.77 |
2.80 |
|
Metal Production1 |
Units |
Recovered Metals |
Payable Metal |
% of Revenue |
|
Palladium |
k oz |
2,028 |
1,905 |
58.7% |
|
Copper |
M lbs |
493 |
467 |
26.8% |
|
Platinum |
k oz |
634 |
537 |
9.6% |
|
Gold |
k oz |
183 |
151 |
3.8% |
|
Silver |
k oz |
3,796 |
2,823 |
1.0% |
|
Note: 1 LOM metal production including pre-production period. |
|
|
||
|
Capital Costs |
Units |
|
|
Initial Capital1 |
$M |
665 |
|
LOM Sustaining Capital |
$M |
423 |
|
LOM Total Capital |
$M |
1,087 |
|
Closure Costs |
$M |
66 |
|
Note: 1 Initial Capital shown after equipment financing. |
||
|
Operating Costs |
Units |
|
|
Mining1 |
$/t mined |
2.53 |
|
Processing |
$/t milled |
9.08 |
|
General & Administration |
$/t milled |
2.48 |
|
Transport & Refining Charges |
$/t milled |
2.80 |
|
Royalties |
$/t milled |
0.03 |
|
Total Operating Costs |
$/t milled |
23.63 |
|
LOM Average Operating Cost |
US$/oz Pd Eq |
687 |
|
LOM Average AISC |
US$/oz Pd Eq |
809 |
|
Note: Refer to Non-IFRS Financial Measures at the end of the news release. 1 Mining cost also noted as $9.23/tonne milled. |
||
|
Economic Analysis Base Case |
Units |
Base Case |
Spot Price1 |
|
Pre-tax Undiscounted Cash Flow |
$M |
3,004 |
5,305 |
|
Pre-tax NPV6% |
$M |
1,636 |
3,042 |
|
Pre-tax IRR |
% |
38.6 |
59.9 |
|
Pre-tax Payback |
years |
1.9 |
1.2 |
|
After-tax Undiscounted Cash Flow |
$M |
2,060 |
3,626 |
|
After-tax NPV6% |
$M |
1,068 |
2,025 |
|
After-tax IRR |
% |
29.7 |
46.5 |
|
After-tax Payback |
years |
2.3 |
1.5 |
|
Note: Spot Price on 22 February 2021: Pd = US$2,395/oz; Cu = US$3.99/lb; Pt = US$1,268/oz; Au = US$1,807/oz; Ag = US$27.45/oz; Pd, Pt, Au and Ag prices sourced LBMA; Cu price sourced on LME Copper. |
|||
Project Cash Flow (After-Tax)
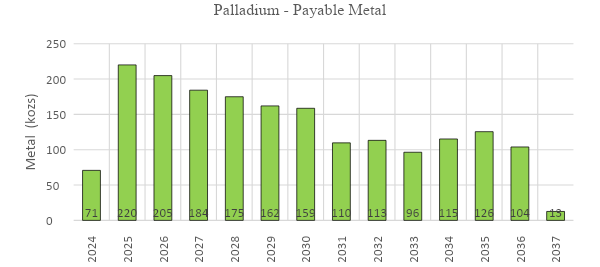
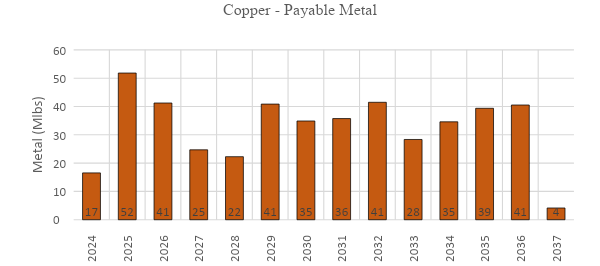
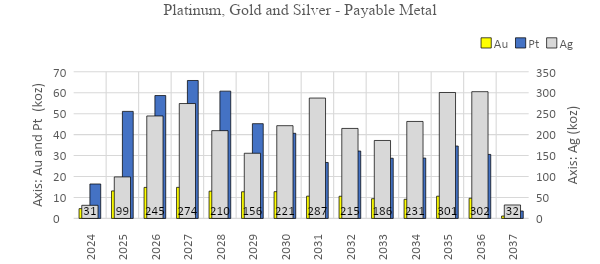
Mine Production Profile - Key Metals
Mining
Mining methods will employ conventional open pit, truck and shovel operating practice. Three pits will be mined over the 13-year mine life, with an additional two years of pre-production mining to be undertaken where waste material is being mined for construction and ore stockpiled ahead of processing plant commissioning. The mining equipment fleet is to be owner-operated and will include outsourcing of certain support activities such as explosives manufacturing and blasting. Production drilling and mining operations will take place on a 10 m bench height. The primary loading equipment will consist of two hydraulic face shovels (29 m3 bucket size) and one large front-end wheel loader (30 m3 bucket size). The loading fleet is matched with a fleet of 13 x 216 tonnes haulage trucks. A fleet of two 90 tonnes excavators will be used to excavate the limited volume of overburden material and will also be allocated to mining of the narrow-thickness ore zones associated with the W-Horizon in the South Pit to mitigate additional dilution.
Mining production at peak capacity is 40 Mt per year (110,000 tonnes per day (“t/d”)). Total material moved over the life of the operation is 447 Mt with 118 Mt of ore mined.
The Marathon Deposit is well defined and characterized by ore outcropping on surface, wide, and moderately dipping mineralized zones.
The open pit operation includes a waste rock dump immediately to the east of the open pits and an ore stockpile (peak capacity of approximately 12 Mt) to the west of the pits, proximal to the crusher location.
Processing
The Project process design is based on the optimized flowsheet as determined by operational considerations and the 2020 metallurgical test programs. The process plant is designed to operate at 9.2 Mt per year (25,200 t/d) and will produce a copper-palladium concentrate for marketing.
The process plant flowsheet includes a conventional comminution circuit consisting of a SAG mill, pebble crusher followed by a ball mill (“SABC”). The flotation portion of the process plant includes rougher flotation, concentrate regrind and three stages of cleaning. After the initial construction phase, the palladium-scavenger (“PGM-Scavenger”) circuit will be installed and including cyclone classification of rougher tailings to reject the fine fraction and submit coarser fractions to additional regrinding and PGM scavenger flotation. The PGM-Scavenger circuit will add incremental recovery improvement to achieve the recoveries established in the 2020 metallurgical testing programs.
|
Metal |
% Recovery at Average Reserve Grade |
Recovery Equations |
|
Palladium |
86.9% |
% Rec Pd = 88.27 x (Pd head grade Exp(0.0338)) , to a maximum of 92% |
|
Copper |
93.0% |
% Rec Cu = 93.0 (constant) |
|
Platinum |
84.2% |
% Rec Pt = 1.22 x (% Rec Pd) - 21.79 |
|
Gold |
72.4% |
% Rec Au = 1.39 x (% Rec Pd) - 48.37 |
|
Silver1 |
71.5% |
% Rec Ag = 71.5 (constant) |
|
Note: 1 Silver recovery assumes prior metallurgical test recoveries. |
||
The flotation circuit design incorporates Woodgrove Direct Flotation Reactors (“DFRs”) which provide decreased power consumption and improved operational performance. Concentrate thickening, concentrate filtering, tailings thickening, water management, and a Tailings Storage Facility (“TSF”) complete the flowsheet.
The below table identifies the key elements in the Cu-PGM concentrate as produced from the mini-pilot plant from the 2020 metallurgical test program.
|
Element |
Unit |
South Pit |
North Pit |
|
Pd |
g/t |
171 |
39 |
|
Cu |
% |
18.7 |
19.7 |
|
Pt |
g/t |
43.5 |
7.6 |
|
Au |
g/t |
17.6 |
3.3 |
|
Ag |
g/t |
> 50 |
68 |
|
Rh |
g/t |
2.4 |
0.58 |
|
Note: Only key elements are listed in this table. The concentrate is low in deleterious elements; no smelter penalties are anticipated in concentrate marketing. |
|||
Site Infrastructure
The existing regional infrastructure in the area of the Project is well established and will allow for the efficient logistics associated with project execution and operations including the movement of the Cu-Pd concentrate to a third-party, off-site smelter.
All site infrastructure facilities, including the roads and access, process plant buildings, workshops, warehouse, administrative buildings, water treatment plants, explosive plant, communication systems, power and power transmission line required for the Project during construction and operation have been considered in the Project design. Off-site infrastructure (including transload concentrate facility, assay lab and accommodation units) required to support the operation have also been included.
The TSF design methodology includes downstream constructed embankments using run-of-mine rockfill with embankments founded directly on bedrock. Majority of the TSF area consists of exposed bedrock with a thin intermittent layer of sand and gravels. The upstream face of embankments includes an HDPE Geomembrane to minimize seepage. The construction methodology includes for bulk material placement with the mining fleet. Directly associated with the TSF is robust water management facilities that are deemed to support the operation and the robust environmental stewardship.
Capital and Operating Cost Summary
The initial capital cost considers a site-based construction timeframe of approximately 18 months followed by a commissioning and ramp-up to commercial production over a period of approximately 9 months. During the pre-commercial production, the costs and revenue associated with operations will be capitalized and included in the capital costs.
Construction Indirects and General and Owner’s costs are related to the expenses other than the direct equipment purchase and direct construction costs.
Sustaining Capital items include future equipment purchases and replacements and major planned component replacements for the mining fleet, the progressive build of the TSF over the life of the operation, installation of the PGM-Scavenger circuit following commercial production and infrastructure developments to support the growth and contribute to operational improvements following initial construction.
|
Capital Costs |
Initial ($ M) |
Sustaining ($ M) |
Total ($ M) |
|
Mining |
127.8 |
184.1 |
311.9 |
|
Process Plant |
269.2 |
38.5 |
307.7 |
|
Infrastructure |
107.7 |
29.3 |
136.9 |
|
Tailings Storage and Water Management |
61.2 |
170.8 |
232.0 |
|
Construction Indirects |
113.5 |
|
|
|
General and Owner’s Cost |
14.9 |
|
|
|
Preproduction, Startup, Commissioning |
(52.9) |
|
|
|
Subtotal (before equipment financing) |
641.4 |
422.6 |
988.5 |
|
Contingency1 |
74.8 |
|
|
|
Subtotal (including contingency) |
716.1 |
|
|
|
Less: Equipment Financing Drawdowns |
(72.4) |
|
|
|
Add: Equipment Lease Payment & Fees |
21.0 |
|
|
|
Total Initial Capital (after equipment financing) |
664.7 |
422.6 |
1087.3 |
|
Closure & Reclamation2 |
|
65.9 |
65.9 |
|
Total Capital Costs |
664.7 |
488.5 |
1153.2 |
|
Note: 1 Contingency included at project sub-category basis and totals approximately 11.7%. 2 Closure cost estimate is $55.1M, additional cost included for carrying cost of closure bond. Sums may not total due to rounding. |
|||
|
Operating Costs |
$ M |
$/tonne milled |
US$/oz Pd Eq |
|
Mining 1 |
1,069 |
9.23 |
268 |
|
Processing |
1,051 |
9.08 |
264 |
|
General & Administration and Others |
287 |
2.48 |
72 |
|
Concentrate Transport Costs |
146 |
1.26 |
37 |
|
Treatment & Refining Charges |
178 |
1.54 |
45 |
|
Royalties |
4 |
0.03 |
1 |
|
LOM Operating Costs |
2,736 |
23.61 |
687 |
|
Closure & Reclamation |
66 |
0.57 |
17 |
|
Sustaining Capital |
423 |
3.65 |
106 |
|
LOM AISC |
3,224 |
27.78 |
809 |
|
Note: 1 Unit mining cost per tonne mined $2.53/t. |
|||
Economic Analysis (presented on a 100% ownership basis, base case assumptions)
The economic cash flow model of the Project, using long-term price of US$1,725/oz for platinum, US$3.20/lb for copper, and a C$/US$ exchange rate of 1.28, generates an after-tax NPV of $1.07 billion, at a 6% discount rate, and an after-tax IRR of 29.7%. Payback is 2.3 years on initial capital. Before taxes, the NPV at 6% is $1.64 billion and IRR is 38.8% with a payback of 1.5 years. The economic analysis is carried out in real terms (i.e., without inflation factors) in Q1 2021 Canadian dollars without any project financing but inclusive of equipment financing and costs for closure bonding.
The Project has significant leverage to the palladium and copper prices. The after-tax valuation sensitivities for the key metrics are shown below.
|
Palladium Price |
1,000 |
1,250 |
1,500 |
1,725 |
1,850 |
2,000 |
2,500 |
|
NPV6% ($M) |
356 |
601 |
847 |
1,068 |
1,190 |
1,337 |
1,831 |
|
Payback (yrs) |
4.3 |
3.2 |
2.6 |
2.3 |
2.1 |
2.0 |
1.6 |
|
IRR (%) |
14.8% |
20.2% |
25.3% |
29.7% |
32.1% |
34.8% |
43.7% |
|
Copper Price |
2.00 |
2.50 |
3.00 |
3.20 |
3.50 |
4.00 |
4.50 |
|
NPV6% ($M) |
792 |
907 |
1,022 |
1,068 |
1,137 |
1,251 |
1,365 |
|
Payback (years) |
2.7 |
2.5 |
2.3 |
2.3 |
2.2 |
2.1 |
2.0 |
|
IRR (%) |
24.7% |
26.8% |
28.9% |
29.7% |
30.9% |
32.9% |
34.8% |
|
After-Tax Results |
OPEX Sensitivity |
||||
|
-20% |
-15% |
0% |
15% |
20% |
|
|
NPV 6% ($M) |
1,270 |
1,220 |
1,068 |
916 |
866 |
|
Payback (yrs) |
2.1 |
2.1 |
2.3 |
2.4 |
2.5 |
|
IRR (%) |
33.0% |
32.2% |
29.7% |
27.1% |
26.2% |
|
After-Tax Results |
CAPEX Sensitivity |
||||
|
-20% |
-15% |
0% |
15% |
20% |
|
|
NPV 6% ($M) |
1,195 |
1,163 |
1,068 |
972 |
940 |
|
Payback (yrs) |
1.9 |
2.0 |
2.3 |
2.6 |
2.7 |
|
IRR (%) |
37.7% |
35.4% |
29.7% |
25.3% |
24.1% |
|
Discount Rate Sensitivity |
NPV (After-Tax) |
|
0% |
2,060 |
|
5% |
1,191 |
|
6% |
1,068 |
|
8% |
859 |
|
10% |
689 |
Mineral Resources
The Mineral Resource Estimate below is for the combined Marathon, Geordie and Sally deposits. The Mineral Resource Estimates were prepared by P&E.
Pit Constrained Combined Mineral Resource Estimate1-8 for the Marathon, Geordie and Sally Deposits (Effective date June 30, 2020)
|
Mineral Category |
Tonnage |
Pd |
Cu |
Au |
Pt |
Ag |
|||||
|
kt |
g/t |
koz |
% |
M lbs |
g/t |
koz |
g/t |
koz |
g/t |
koz |
|
|
Marathon Deposit |
|||||||||||
|
Measured |
113,793 |
0.63 |
2,304 |
0.20 |
502 |
0.07 |
262 |
0.21 |
762 |
1.49 |
5,466 |
|
Indicated |
89,012 |
0.45 |
1,296 |
0.19 |
373 |
0.06 |
182 |
0.16 |
449 |
1.77 |
5,078 |
|
M+I |
202,806 |
0.55 |
3,599 |
0.20 |
875 |
0.07 |
444 |
0.19 |
1,211 |
1.62 |
10,544 |
|
Inferred |
6,931 |
0.43 |
95 |
0.17 |
26 |
0.08 |
17 |
0.14 |
32 |
1.55 |
345 |
|
Geordie Deposit |
|||||||||||
|
Indicated |
17,268 |
0.56 |
312 |
0.35 |
133 |
0.05 |
25 |
0.04 |
20 |
2.4 |
1,351 |
|
Inferred |
12,899 |
0.51 |
212 |
0.28 |
80 |
0.03 |
14 |
0.03 |
12 |
2.4 |
982 |
|
Sally Deposit |
|||||||||||
|
Indicated |
24,801 |
0.35 |
278 |
0.17 |
93 |
0.07 |
56 |
0.2 |
160 |
0.7 |
567 |
|
Inferred |
14,019 |
0.28 |
124 |
0.19 |
57 |
0.05 |
24 |
0.15 |
70 |
0.6 |
280 |
|
Total Project |
|||||||||||
|
Measured |
113,793 |
0.63 |
2,304 |
0.20 |
502 |
0.07 |
262 |
0.21 |
762 |
1.49 |
5,466 |
|
Indicated |
131,081 |
0.45 |
1,886 |
0.21 |
599 |
0.06 |
263 |
0.15 |
629 |
1.66 |
6,996 |
|
M+I |
244,874 |
0.53 |
4,190 |
0.20 |
1,101 |
0.07 |
525 |
0.18 |
1,391 |
1.58 |
12,462 |
|
Inferred |
33,849 |
0.40 |
431 |
0.22 |
163 |
0.05 |
55 |
0.10 |
114 |
1.48 |
1,607 |
|
Notes:
|
|||||||||||
Mineral Reserves
The Mineral Reserve Estimate for the Marathon Project includes only the Marathon deposit. The Mineral Reserve Estimate was prepared by GMS.
Marathon Project Open Pit Mineral Reserve Estimates1-8 (Effective date September 15, 2020)
|
Mineral Category |
Tonnage |
Pd |
Cu |
Au |
Pt |
Ag |
||||||
|
kt |
% |
g/t |
koz |
% |
M lbs |
g/t |
koz |
g/t |
koz |
g/t |
koz |
|
|
Proven |
85,091 |
72 |
0.660 |
1,805 |
0.202 |
379 |
0.070 |
191 |
0.212 |
581 |
1.359 |
3,719 |
|
Probable |
32,610 |
28 |
0.512 |
537 |
0.213 |
153 |
0.061 |
64 |
0.168 |
176 |
1.541 |
1,616 |
|
P+P |
117,701 |
100% |
0.619 |
2,342 |
0.205 |
532 |
0.067 |
255 |
0.200 |
756 |
1.410 |
5,334 |
Notes:
Community, Environment and Permitting
The Project is currently progressing with the Environment Approval process. The initial volume of the Environment Impact Assessment (“EIS Addendum”) was issued in January 2021, with the second volume expected to be completed later in the first quarter of 2021. The Project is being assessed in accordance with the Canadian Environmental Assessment Act (“CEAA, 2012”) and Ontario’s Environmental Assessment Act through a Joint Review Panel pursuant to the Canada-Ontario Agreement on Environmental Assessment Cooperation (2004).
The Company and its predecessors have been engaged in consultation and negotiations with a number of Indigenous communities and regional municipalities with respect to the Project since 2004. The Company along with the identified communities are progressing relationships through regular meetings and interactions to advance towards the development of the Project. Gen Mining is striving to ensure these partnerships have mutually beneficial outcomes and anticipates strong and long-lasting relationships with these groups.
Qualified Persons
The news release has been reviewed and approved by Drew Anwyll, P.Eng., M.Eng., Chief Operating Officer of the Company, and a Qualified Person as defined by Canadian Securities Administrators National Instrument 43-101 (“NI43-101”) “Standards of Disclosure for Mineral Projects”. The technical information in this news release has been reviewed and approved by the following independent Qualified Person: Louis-Pierre Gignac, Ing.
The Feasibility Study was prepared through the collaboration of the following consulting firms and Qualified Persons:
|
Consulting Firms |
Area of Responsibility |
Qualified Person |
|
G-Mining Services |
Mineral Reserves Estimate |
Antoine Champagne, ing. |
|
Ausenco Engineering Canada Inc. |
Metallurgical Testing |
Robert Raponi, P.Eng |
|
P&E Mining Consultants Inc. |
Mineral Resource Estimate |
Eugene Purich, P.Eng., FEC, CET |
|
Knight Piésold Ltd. |
Tailings design and water management |
Craig Hall, P.Eng |
NI 43-101 Technical Report
Gen Mining plans to file an NI 43-101 Technical Report for the Marathon Project Feasibility Study within 45 days of this news release. Readers are encouraged to read the Technical Report in its entirety, including all qualifications, assumptions and exclusions that relate to the details summarized in this news release. The Technical Report is intended to be read as a whole, and sections should not be read or relied upon out of context.
The Company has prepared a presentation that summarizes the Feasibility Study results of the Project which is available on the Company’s website.
Feasibility Study Approval by the Joint Venture
Sibanye-Stillwater and the Joint Venture management committee have not reviewed nor approved the Feasibility Study at this time.
About Generation Mining
Gen Mining’s focus is the development of the Marathon Project, the largest undeveloped palladium-copper Mineral Resource in North America. The Marathon property covers a land package of approximately 22,000 hectares, or 220 square kilometres. Gen Mining owns an 80% interest in the Marathon Project, with the remaining interest owned by Sibanye Stillwater, which has certain back-in rights that allow it to increase its interest in the Marathon Project to 51% in certain circumstances and subject to certain conditions after such time a positive production decision has been made (see the Company’s news release of July 11, 2019 for more details).
For further information please contact:
Jamie Levy, President and Chief Executive Officer
(416) 640-2934 / (416) 567-2440
[email protected]
Non-IFRS Financial Measures
The Company has included certain terms or performance measures commonly used in the mining industry that are not defined under International Financial Reporting Standards (“IFRS”) in this news release. These include operating costs, AISC, LOM average AISC, LOM average operating cost, and Free Cash Flow. Non-IFRS measures do not have any standardized meaning prescribed under IFRS, and therefore, they may not be comparable to similar measures employed by other companies. The data presented is intended to provide additional information and should not be considered in isolation or as a substitute for measures prepared in accordance with IFRS. These measures do not have any standardized meaning prescribed under IFRS, and therefore may not be comparable to other issuers.
Information Concerning Estimates of Mineral Reserves and Resources
The Mineral Reserve and Mineral Resource estimates in this press release have been disclosed in accordance with NI 43-101, which differs significantly from the requirements of the U.S. Securities and Exchange Commission (the “SEC”), and information with respect to mineralization and Mineral Reserves and Mineral Resources contained herein may not be comparable to similar information disclosed by U.S. companies. The requirements of NI 43-101 for identification of ‘‘reserves’’ are not the same as those of the SEC, and reserves reported by the Company in compliance with NI 43-101 may not qualify as ‘‘reserves’’ under SEC standards. Under U.S. standards, mineralization may not be classified as a ‘‘reserve’’ unless the determination has been made that the mineralization could be economically and legally produced or extracted at the time the reserve determination is made. In addition, and without limiting the generality of the foregoing, this press release uses the terms ‘‘Measured Resources’’, ‘‘Indicated Resources’’ and ‘‘Inferred Resources’’. U.S. investors are advised that, while such terms are recognized and required by Canadian securities laws, the SEC has not recognized them in the past. U.S. investors are cautioned not to assume that any part of a ‘‘Measured Resource’’ or ‘‘Indicated Resource’’ will ever be converted into a ‘‘reserve’’. U.S. investors should also understand that ‘‘Inferred Resources’’ have a great amount of uncertainty as to their existence and as to their economic and legal feasibility. It cannot be assumed that all or any part of ‘‘Inferred Resources’’ exist, are economically or legally mineable or will ever be upgraded to a higher category. Under Canadian securities laws, ‘‘Inferred Resources’’ may not form the basis of feasibility or pre-feasibility studies except in certain cases. Disclosure of ‘‘contained ounces’’ in a Mineral Resource is a permitted disclosure under Canadian securities laws, however, the SEC normally only permits issuers to report mineralization that does not constitute ‘‘reserves’’ by SEC standards as in place tonnage and grade, without reference to unit measures. Accordingly, information concerning mineral deposits set forth in this press release may not be comparable with information made public by companies that report in accordance with U.S. standards.
The SEC has adopted amendments to its disclosure rules to modernize the mineral property disclosure requirements under the U.S. Securities Exchange Act of 1934, as amended (the “Exchange Act”). These amendments became effective February 25, 2019 (the “SEC Modernization Rules”) with compliance required for the first fiscal year beginning on or after January 1, 2021. Under the SEC Modernization Rules, the historical property disclosure requirements for mining registrants included in Industry Guide 7 under the U.S. Securities Act of 1933, as amended, will be rescinded and replaced with disclosure requirements in subpart 1300 of SEC Regulation S-K. As a result of the adoption of the SEC Modernization Rules, the SEC now recognizes estimates of “Measured Mineral Resources”, “Indicated Mineral Resources” and “Inferred Mineral Resources.” In addition, the SEC has amended its definitions of “Proven Mineral Reserves” and “Probable Mineral Reserves” to be “substantially similar” to the corresponding standards under NI 43-101. While the SEC will now recognize “Measured Mineral Resources”, “Indicated Mineral Resources” and “Inferred Mineral Resources”, U.S. investors should not assume that any part or all of the mineralization in these categories will ever be converted into a higher category of Mineral Resources or into Mineral Reserves. Mineralization described using these terms has a greater amount of uncertainty as to its existence and feasibility than mineralization that has been characterized as reserves. Accordingly, U.S. investors are cautioned not to assume that any Measured Mineral Resources, Indicated Mineral Resources, or Inferred Mineral Resources that the Company reports are or will be economically or legally mineable. Further, “Inferred Mineral Resources” have a greater amount of uncertainty as to their existence and as to whether they can be mined legally or economically. Therefore, U.S. investors are also cautioned not to assume that all or any part of the “Inferred Mineral Resources” exist. There is no assurance that any Mineral Reserves or Mineral Resources that the Company may report as “Proven Mineral Reserves”, “Probable Mineral Reserves”, “Measured Mineral Resources”, “Indicated Mineral Resources” and “Inferred Mineral Resources” under NI 43-101 would be the same had the Company prepared the reserve or resource estimates under the standards adopted under the SEC Modernization Rules.
Mineral Resources are not Mineral Reserves, and do not have demonstrated economic viability, but do have reasonable prospects for economic extraction. Measured and Indicated Mineral Resources are sufficiently well defined to allow geological and grade continuity to be reasonably assumed and permit the application of technical and economic parameters in assessing the economic viability of the Mineral Resource. Inferred Mineral Resources are estimated on limited information not sufficient to verify geological and grade continuity or to allow technical and economic parameters to be applied. Inferred Mineral Resources are too speculative geologically to have economic considerations applied to them to enable them to be categorized as Mineral Reserves. There is no certainty that Mineral Resources of any classification can be upgraded to Mineral Reserves through continued exploration.
The Company’s Mineral Reserve and Mineral Resource figures are estimates and the Company can provide no assurances that the indicated levels of mineral will be produced or that the Company will receive the price assumed in determining its Mineral Reserves. Such estimates are expressions of judgment based on knowledge, mining experience, analysis of drilling results and industry practices. Valid estimates made at a given time may significantly change when new information becomes available. While the Company believes that these Mineral Reserve and Mineral Resource Estimates are well established and the best estimates of the Company’s management, by their nature Mineral Reserve and Mineral Resource Estimates are imprecise and depend, to a certain extent, upon analysis of drilling results and statistical inferences which may ultimately prove unreliable. If the Company’s Mineral Reserve or Mineral Reserve Estimates are inaccurate or are reduced in the future, this could have an adverse impact on the Company’s future cash flows, earnings, results or operations and financial condition.
The Company estimates the future mine life of the Marathon Project. The Company can give no assurance that its mine life estimate will be achieved. Failure to achieve this estimate could have an adverse impact on the Company’s future cash flows, earnings, results of operations and financial condition.
Cautionary Note Regarding Forward-Looking Information
This news release contains certain forward-looking information and forward-looking statements, as defined in applicable securities laws (collectively referred to herein as “forward-looking statements”). Forward-looking statements reflect current expectations or beliefs regarding future events or the Company’s future performance. All statements other than statements of historical fact are forward-looking statements. Often, but not always, forward-looking statements can be identified by the use of words such as “plans”, “expects”, “is expected”, “budget”, “scheduled”, “estimates”, “continues”, “forecasts”, “projects”, “predicts”, “intends”, “anticipates”, “targets” or “believes”, or variations of, or the negatives of, such words and phrases or state that certain actions, events or results “may”, “could”, “would”, “should”, “might” or “will” be taken, occur or be achieved, including statements relating to the Company’s Feasibility Study and results therefrom (including NPV, IRR, capital and operating costs and other financial metrics), Mineral Resource and Mineral Reserve potential, exploration plans, or the ability of the Company and Sibanye Stillwater to vary their respective participating interests in the Marathon Property. All forward-looking statements, including those herein are qualified by this cautionary statement.
Although the Company believes that the expectations expressed in such statements are based on reasonable assumptions, such statements are not guarantees of future performance and actual results or developments may differ materially from those in the statements. There are certain factors that could cause actual results to differ materially from those in the forward-looking information. These include commodity price volatility, continued availability of capital and financing, uncertainties involved in interpreting geological data, increases in costs, environmental compliance and changes in environmental legislation and regulation, the Company’s relationships with First Nations communities, exploration successes, and general economic, market or business conditions, as well as those risk factors set out in the Company’s annual information form, the Technical Report that the Company will file in connection with the Feasibility Study and in the continuous disclosure documents filed by the Company on SEDAR at www.sedar.com. Readers are cautioned that the foregoing list of factors is not exhaustive of the factors that may affect forward-looking statements. Accordingly, readers should not place undue reliance on forward-looking statements. The forward-looking statements in this news release speak only as of the date of this news release or as of the date or dates specified in such statements.
Forward-looking statements are based on a number of assumptions which may prove to be incorrect, including, but not limited to, assumptions relating to: the availability of financing for the Company’s operations; operating and capital costs; results of operations; the mine development and production schedule and related costs; the supply and demand for, and the level and volatility of commodity prices; timing of the receipt of regulatory and governmental approvals for development projects and other operations; the accuracy of Mineral Reserve and Mineral Resource Estimates, production estimates and capital and operating cost estimates; and general business and economic conditions.
Investors are cautioned that any such statements are not guarantees of future performance and actual results or developments may differ materially from those projected in the forward-looking information. For more information on the Company, investors are encouraged to review the Company’s public filings on SEDAR at www.sedar.com. The Company disclaims any intention or obligation to update or revise any forward- looking information, whether as a result of new information, future events or otherwise, other than as required by law.